


“The information you have is not the information you want. The information you want is not the information you need. The information you need is not the information you can obtain. The information you can obtain costs more than you want to pay” – Peter L. Bernstein ||
Hello everyone! I hope you’re taking care of yourselves.
A macro/markets ramble today, with a ton of charts. I wasn’t able to add the usual “term of the day” as I’ve been valiantly battling an invasion of ants into my workspace – ok, “valiantly” is perhaps a stretch as my battle consisted of wielding a spray and beating a horrified retreat to work in the kitchen. I know that they’re tiny little creatures and I wish I could pretend to be cool and compassionate about this, but I’m not going to lie: a trail of them marching across my laptop keyboard freaks me out. Please wish me luck in this fight.
👀 You’re reading Crypto is Macro Now, which covers the role crypto is playing in the changing plates of finance, economics, politics, culture and markets. 👀
PUBLISHED IN PARTNERSHIP WITH: ✨ ALLIUM ✨
Tokenized Treasuries: How They Work and Why They Matter
Tokenized treasuries have become the largest category of real-world assets onchain. Allium Research breaks down how they actually work and why institutions are moving so fast to bring them onchain. The mechanics matter, and so does what happens next.
→ Check out the report: https://www.allium.so/blog/tokenized-treasuries-how-they-work-and-why-they-matter/
And get weekly onchain data and analysis like this from the Allium Research team on Substack.
IN THIS NEWSLETTER
A tale of two markets
Crypto is Macro Now offers ~daily commentary and updates on the overlap between the crypto and macro landscapes. Plus links and more.
If you’re a premium subscriber, thank you so much!! ❤
WATCHING:

A tale of two markets
“It was the best of times, it was the worst of times…” So begins my favourite Charles Dickens novel, A Tale of Two Cities. This came to mind as I was wondering what to call today’s macro rambling, and while the full opening sentence is of course much more majestic than the snippet suggests, it does highlight the co-existence of diverging trends and our consequent confusion.
Over the past few days, we’ve had good economic reports, and also not-so-good. There are some market indicators that are glowing, others that are dire. Of course, this is all uncomfortable as us humans like to make sense of things – but with the jigsaw puzzle pieces up in the air, we’ll have to make do with small snapshots that just might eventually form a coherent landscape.
Below, for the sake of flow, I’ll separate the data I’m looking at on the macro front from market indicators. Since I prefer ending on a positive or at least neutral tone, let’s start with a glimpse of the not-so-good news.
Macro: Consumer sentiment
Friday’s report from the University of Michigan consumer survey showed sentiment falling for the first time in three months. One-year inflation expectations ticked up to 4.3%.
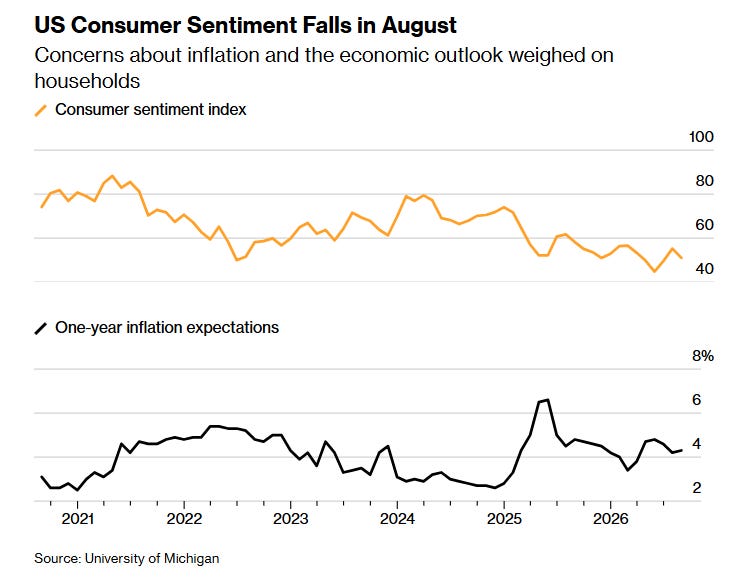
(chart via Bloomberg)
Gauges on current economic conditions and consumer expectations also dipped, coming in well below the consensus forecast.
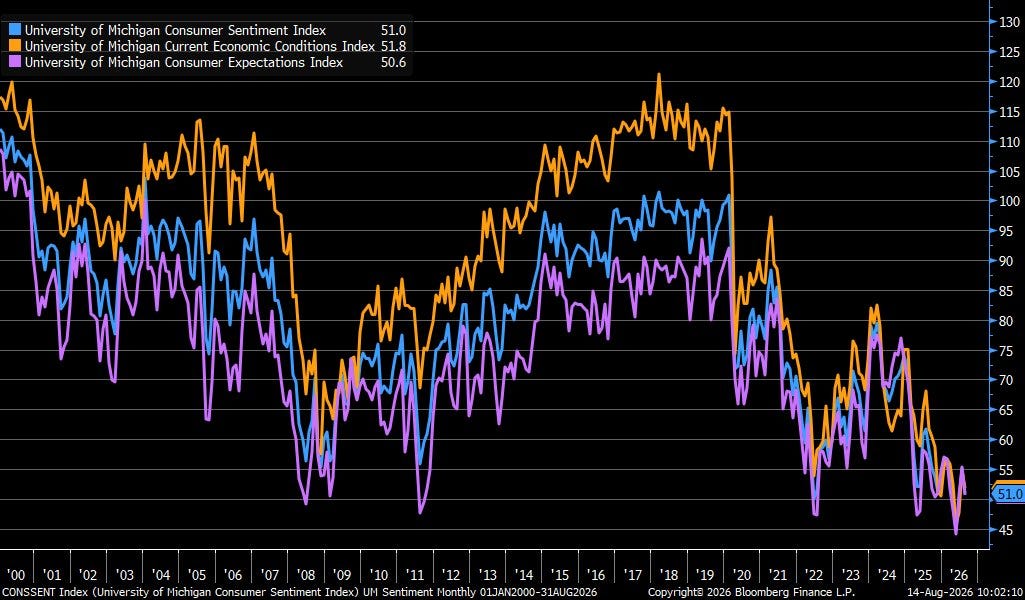
(chart via @LizAnnSonders)
As always, the real story is in the details.
Check out the drop in sentiment from Republican respondents – this sub-index hit its lowest point since late 2024, before Donald Trump won the White House.
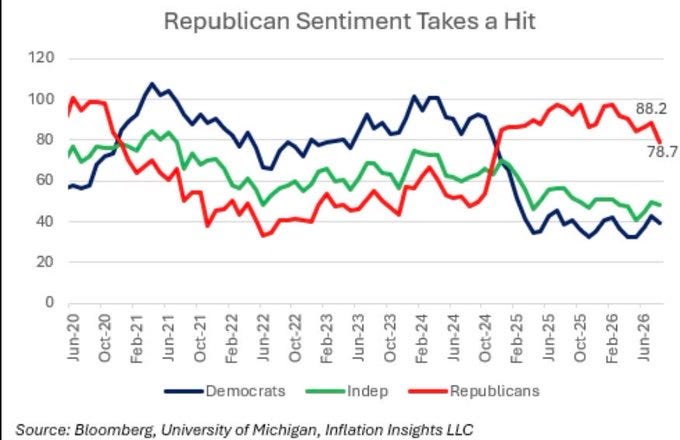
(chart via @fcastofthemonth)
What’s more, this dip coincides with the findings in a Financial Times poll published over the weekend: a significant percentage of Republicans are not happy with the Administration’s economic policies. Around 40% of Republican respondents think the economy is heading in the wrong direction, and almost a quarter feel worse off than before Trump took office. And this is with three months to go before the midterm elections.
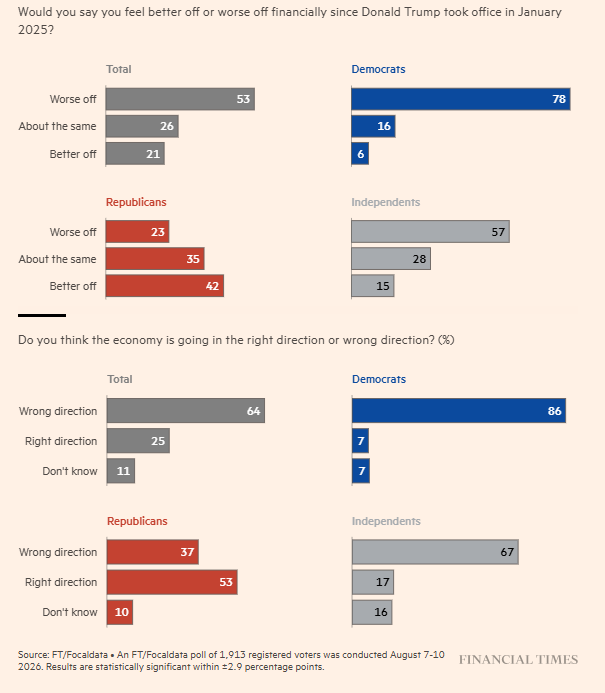
(chart via the Financial Times)
Also, taking a look at the mean (average) 1-year inflation expectation rather than the median (midpoint) gives a better idea of the range – how many respondents expect higher vs lower inflation, and by how much?
The mean expectation of 1-year inflation is up to 7.9%, not far from its 2022 high of 8.2%.
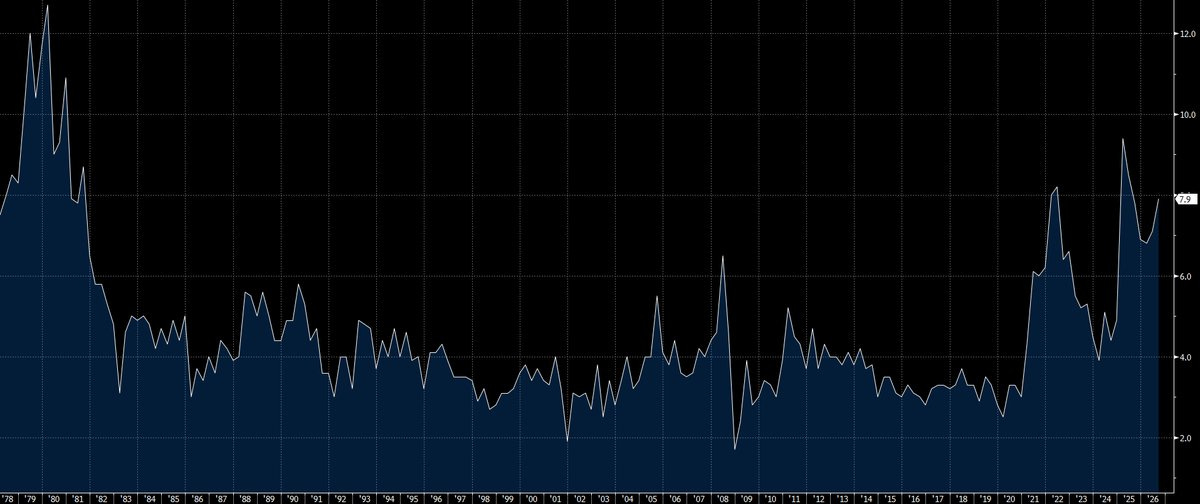
(chart via @DannyDayan5)
And the proportion of respondents that expect interest rates to rise hit 53%, the highest since November 2023. No wonder the mood is grim.
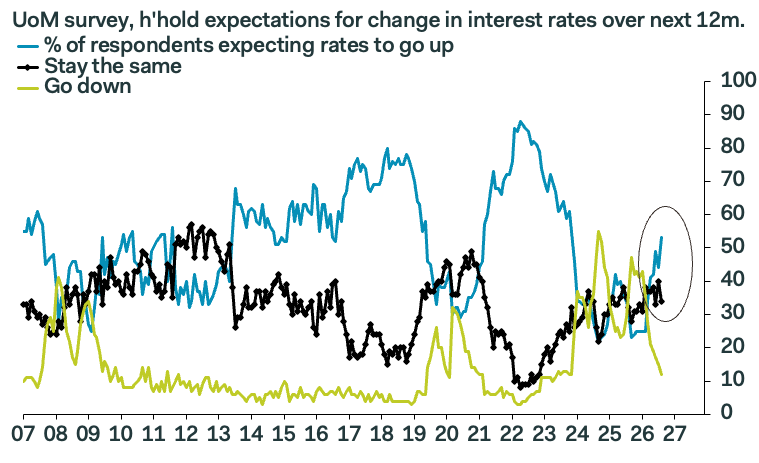
(chart via @samueltombs)
Macro: US retail sales
You’d think that higher inflation expectations would boost spending as consumers bring forward plans. But the Friday US retail sales release showed that this did not happen in July, perhaps influenced by declining real wages (down 0.2% year-on-year).
The nominal value of retail purchases fell 0.6% month-on-month in July, the steepest drop since May 2025. Excluding autos and gasoline, the decrease was trimmed to 0.2%.
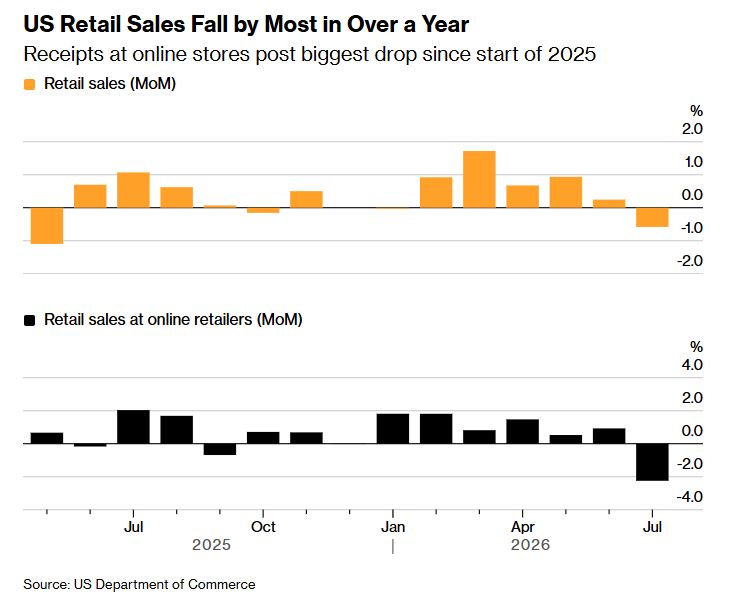
(chart via Bloomberg)
The slump in retail spending is also no doubt in part due to lower savings. At the end of June, the US savings rate was down to 2.7%, less than half where it was two years ago and close to the lowest on record for a data series that goes back to 1947.
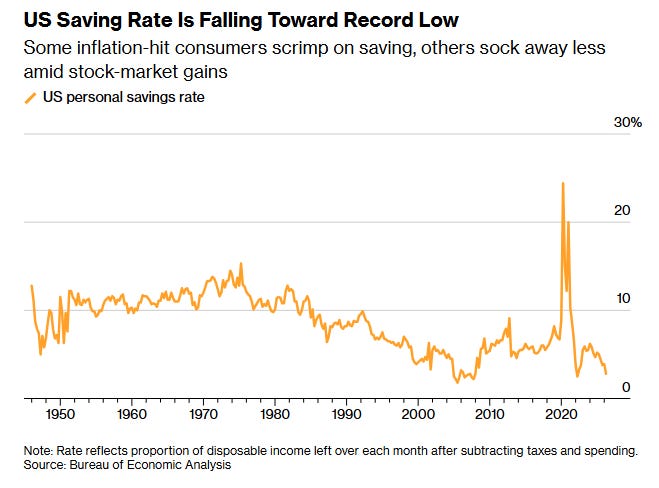
(chart via Bloomberg)
If this continues to head lower, do consumers pull back even more on spending, or do they increase household debt?
There was an intriguing standout in the retail sales report, which leaves me hopeful about our resistance to the impact of AI on culture and mindset:
Looking at the category breakdown in retail sales, the steepest three-month spending increase vs a year ago – other than gasoline – came from hobby, musical instrument, sporting goods and book stores, up 11.5%. This compares to a year-on-year increase of 5.6% at the end of 2025, and a spending decline the previous two year. We’re spending a lot more on stuff that makes us feel more human. I love knowing that.
