

Friday, August 4, 2023

“There is nothing like looking, if you want to find something. You certainly usually find something, if you look, but it is not always quite the something you were after.” ― J.R.R. Tolkien ||
Hello everyone, and happy Friday! You’re reading the premium daily Crypto is Macro Now newsletter, where I focus on the growing overlap between the crypto and macro ecosystem. Thanks so much for being a subscriber! Nothing I say is investment advice. Nevertheless, I hope you find it useful – if so, please consider hitting the Like ❤ button at the bottom, I’m told it boosts the distribution algorithm.
If you’re not yet a subscriber, I hope you’ll think about becoming one to support my work. It would REALLY (really, really) make my day! 😊 It’s currently only $8/month (with a free trial!), although I will be raising the price at the end of the summer.
IN TODAY’S NEWSLETTER
Bond yields sending signals
The politics of money
Coinbase and transaction volumes
More ETH ETFs
WHAT I’M WATCHING
Bond yields sending signals
The crypto market may still be lacking in excitement, but that is not the case in the US bond market, which all of a sudden is flinging off a range of signals that the narrative is shifting.
Yesterday, the spread between the US 10-year and 2-year yields – which just a month ago was at its most inverted since 1981 – narrowed to 0.7 for the first time since late May.

(chart via TradingView)
Why it matters:
Normally, the 10-year yield should be higher than that of shorter-dated bonds, largely to compensate for the risk of holding a bond for longer. When short-term bonds yield more than long-term bonds, the market is sending a signal that the short-term economic outlook is even more uncertain than that of the long-term, and deserves a higher risk premia. We refer to a downwardly sloping yield curve as “inverted” and, over the past few decades, it has unfailingly signalled that a recession is near.
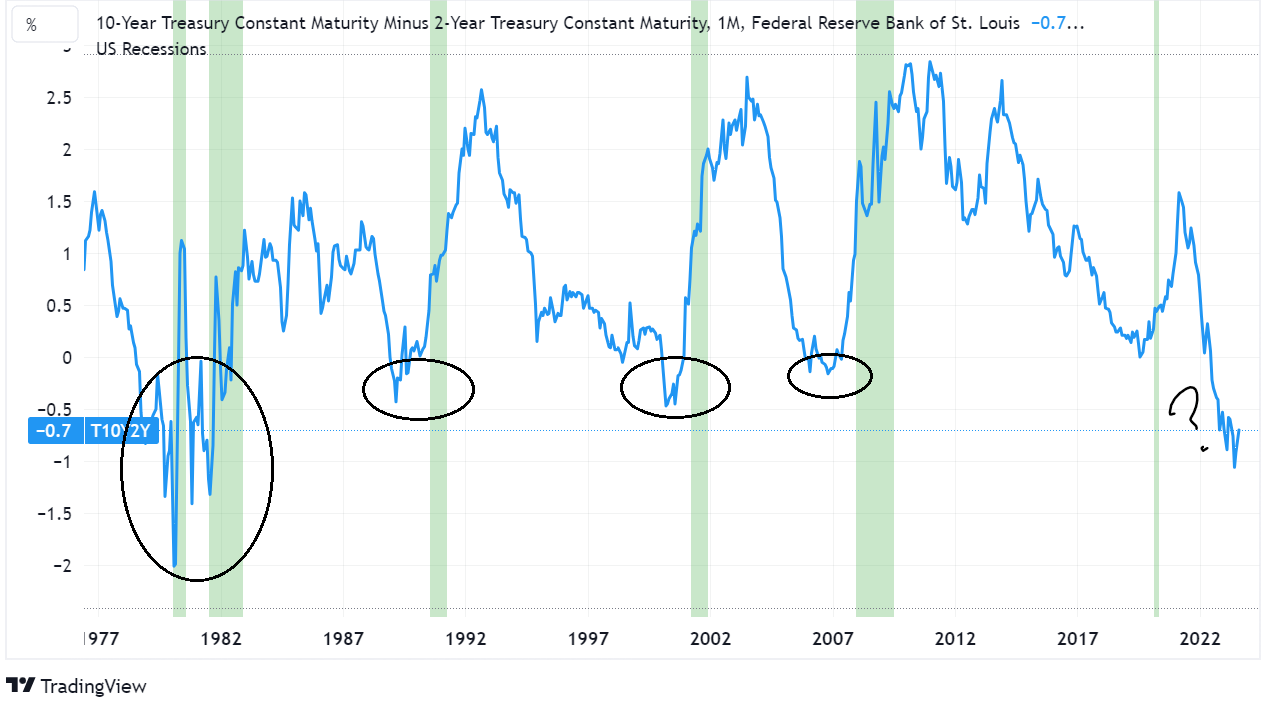
(chart via TradingView)
The US government bond yield inverted last July, using the difference between the 10-year and 2-year yields as a proxy. This spread continued to head down in the second half of 2022 and the first quarter of 2023, bounced during the bank crisis turmoil in March, but turned again and at the beginning of July reached its lowest point since 1981. And yet many observers continue to insist that a recession can be avoided.
This week’s inflection in the spread is significant. Take a look at the timing of stock market peaks in the chart below – they tend to coincide with or follow shortly after the bottom of the yield curve inversion.
