


“Things may come to those who wait, but only the things left by those who hustle.” – Abraham Lincoln ||
Hello everyone! How can it be Monday already…
I rewatched The Bourne Identity with husband yesterday. Such a good film – it’s not just the gripping plot and the good casting – let me tell you, the camera work and the role of the music are surprisingly under-appreciated.
👀 You’re reading Crypto is Macro Now, where I track the role crypto is playing in the changing economic, market and political landscapes. 👀
Production note: as I said earlier this summer, I’m not taking a European-style big vacation but I will be taking days off here and there – like this coming Friday, for instance. 🐟
PUBLISHED IN PARTNERSHIP WITH: ✨ ALLIUM ✨
USDC absorbed 82% of the stablecoin market’s Q2 decline
Stablecoin supply fell $4.4B between March 31 and June 30. USDC accounted for $3.6B of that fall, while USDT added $0.4B and challenger stablecoins continue to grow.
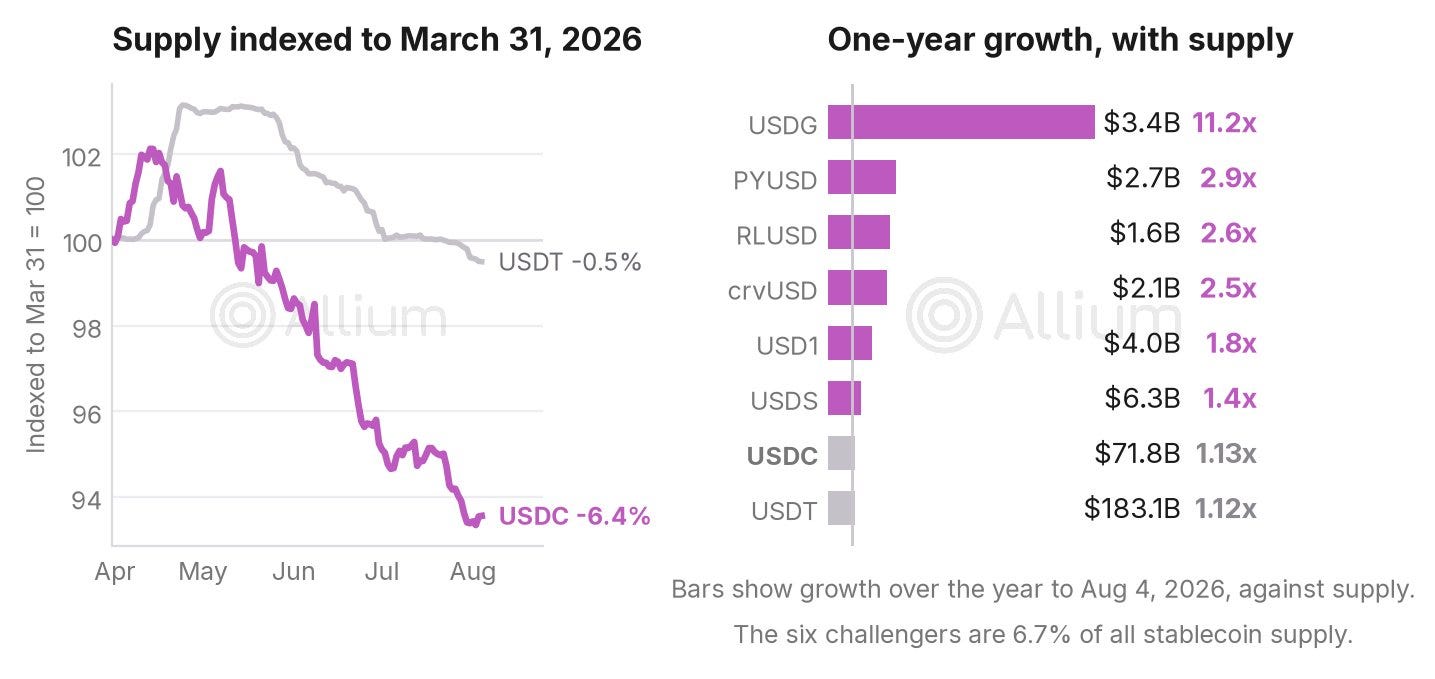
→ Download the full report: https://allium.so/reports/circle-q2-2026-usdc-revenue
And get weekly onchain data and analysis like this from the Allium Research team on Substack.
IN THIS NEWSLETTER
Coming up this week: US CPI + PPI
Macro: the US jobs report was not that bad
Term of the day: marginally attached
Planned for this week: an overlooked liquidity hint, the CLARITY Act outlook, South Africa’s proposed stablecoin ban and more.
Crypto is Macro Now offers ~daily commentary and updates on the overlap between the crypto and macro landscapes. Plus links and more.
If you’re a premium subscriber, thank you so much!! ❤
WHAT I’M WATCHING:

Coming up this week: US CPI + PPI
This week is thin on macro data, with the exception of the US CPI report which could move rate expectations.
On Tuesday, we get the NFIB Business Optimism Index, which will give us in indication of the mood among small business owners.
On Wednesday, the US Bureau of Labor Statistics (BLS) publishes the US CPI report for July. The consensus forecast for the headline inflation is 3.4% year-on-year (down slightly from June’s 3.5%), and 0.1% for the month (up from June’s -0.4% contraction). Core inflation is forecast to come in at 2.5% year-on-year (down slightly from June’s 2.6%) and 0.2% for the month (vs 0% in June).
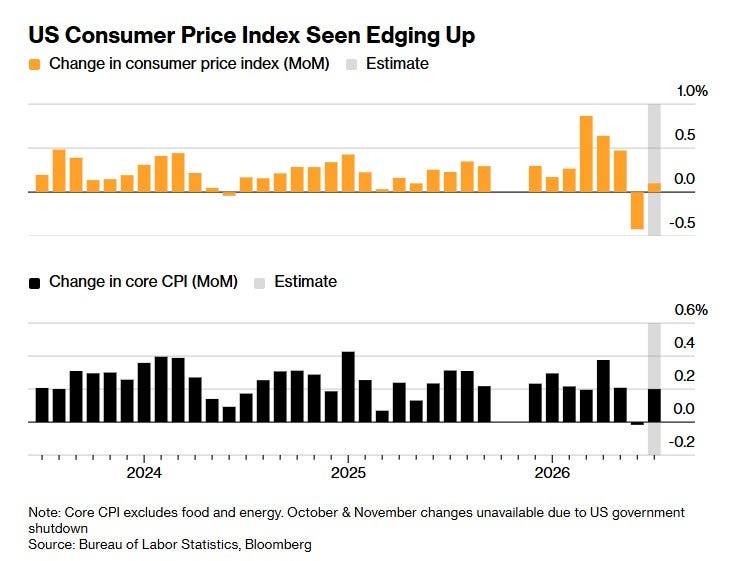
(chart via Bloomberg)
We also get the IEA and OPEC monthly oil reports.
Thursday brings the July read on the Producer Price Index (PPI), a gauge of wholesale inflation – excluding energy, food and trade services, this is forecast to hold steady at 5.1% year-on-year.
It’s also the day of a curious local election in the UK: Reform leader Nigel Farage is running for the Clacton parliamentary seat, with Count Binface as his main challenger after candidates from the other main parties withdrew. (I wrote about Count Binface here.)
Friday brings US retail sales for July, forecast to show a softening to 0.1% growth month-on-month, from June’s 0.2%.
We also get the initial University of Michigan survey for August, expected to show the first consumer sentiment decline in three months.
🌻
Macro: the US jobs was not that bad
Friday’s US jobs report has been called the “something for everybody” release as it contained notable surprises, both good and bad.
Let’s get the bad news out of the way first: jobs contracted for the first time since February. Net payrolls came in at -23,000, way lower than the expected gain of 80,000.
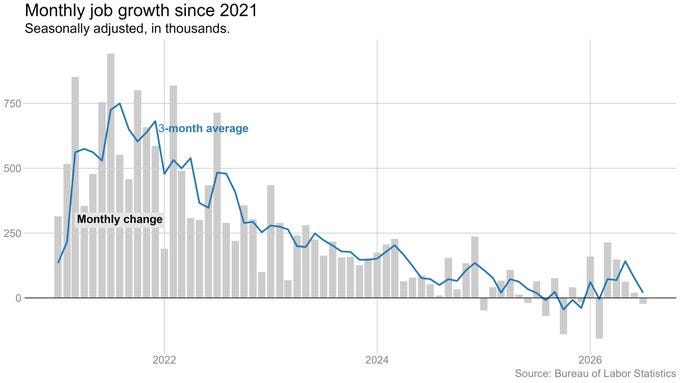
(chart via @bencasselman)
What’s more, the previously reported increase for June was revised down from a gain of 57,000 to a measly +20,000, bringing the three-month average net gain down to 20,000.
This is not what you’d expect to see in an economy with robust growth, even taking into account likely statistical anomalies – although we could see further strong revisions of July’s data in the August report (in either direction).
But almost all of the drop came from the public sector, especially local government education employees – a seasonal dip that we are likely to see adjust come September. Private sector employment increased by around 30,000, lower than the forecast 78,000 but flat on June’s downwardly revised number. Not booming, but not terrible.
And, arguably the unemployment rate is the metric to watch. Numbers expressed in percentages a better gauge of relative moves and a more reliable picture of the macro forces at work. Also, we know from the FOMC’s economic projections that the rate-setters focus on the unemployment rate, not payrolls.
And the July unemployment rate actually ticked down from 4.2% to 4.1%, below the consensus forecast and the lowest level in over a year.
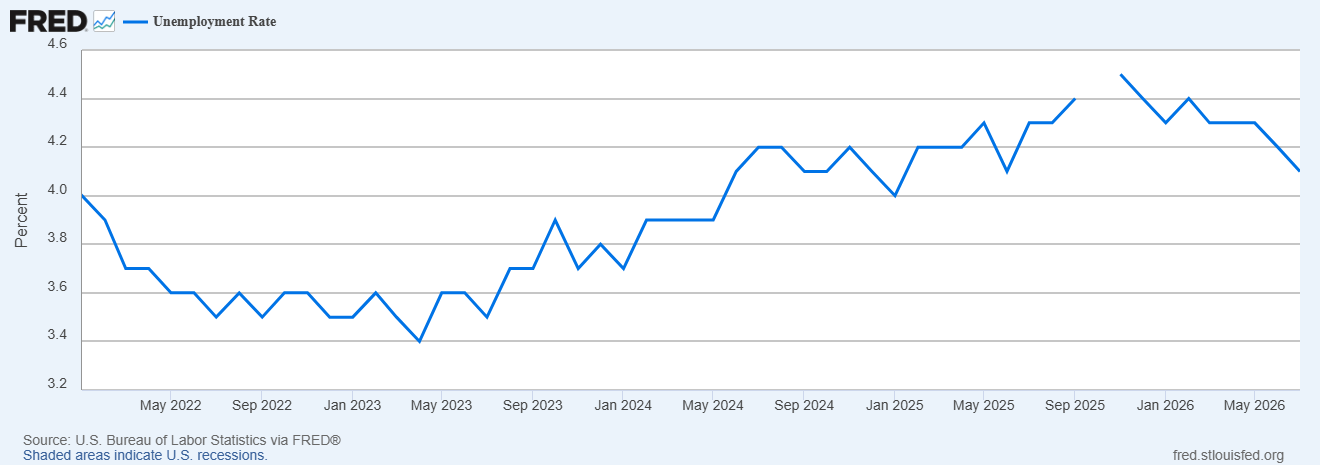
(chart via the St. Louis Fed)
How can the unemployment rate fall when more people lose a job than gain one?Because the workforce is shrinking.
In January, the BLS revised down its estimate of the working population, and did not adjust the data for previous years (it doesn’t do that for this series). But even aside from that, the latest report showed the steepest January-July decline in labour force participation on record outside the pandemic, and the lowest July reading since 1975.
