Thursday, April 11, 2024
the CPI damage, the Uniswap silver lining, HK ETFs, and more
“Periods of tranquility are seldom prolific of creative achievement. Mankind has to be stirred up.” – Alfred North Whitehead ||
Hi everyone, and happy Thursday! Yes, I’m getting ahead of the Friday cheer. Anyway, how about that US inflation print… Much to discuss below.
If you find this newsletter useful, would you mind sharing it with your friends and colleagues? ❤
IN THIS NEWSLETTER:
US March CPI: Damage done
Why the SEC’s Uniswap move is a big deal
Hong Kong ETFs
Sanctions on US companies
If you’re not a subscriber to the premium daily, I hope you’ll consider becoming one! You’ll get ~daily insight into the growing overlap between the crypto and macro landscapes, as well as some useful links, and (usually!) access to an audio read of the content. And there’s a free trial!
WHAT I’M WATCHING:
US March CPI: Damage done
By now, you’ve probably seen that the US CPI data for March came in much hotter than expected, which was not really a surprise, but was startling nevertheless.
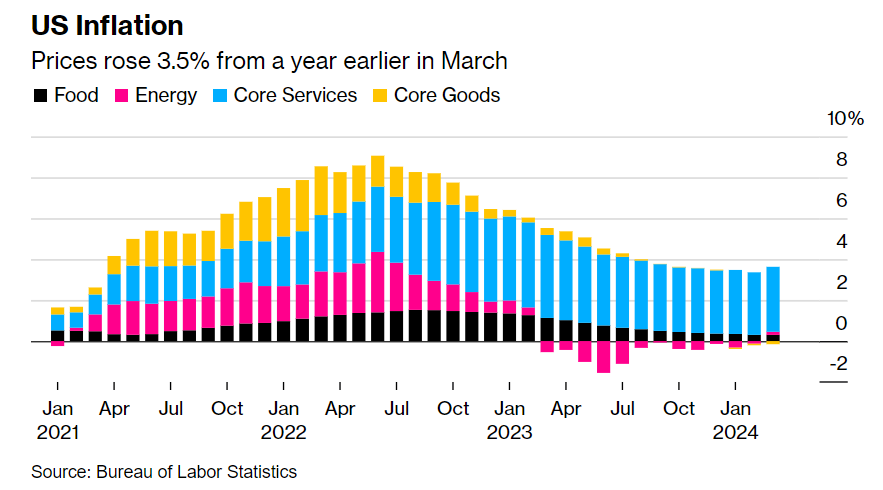
Consensus estimates had suggested a headline CPI annual growth of 3.4%, which already was ahead of February’s 3.2%. The actual figure came in at 3.5%.
(chart via Bloomberg)
Growth of core CPI, ex-energy and food, shrugged off the expected slight deceleration, and held steady at 3.8%, almost double the Fed’s official target.
The month-on-month growth for the headline and core indices both came in slightly above expectations of 0.3%, to hold steady at 0.4%.
All of that is indeed disappointing. But the situation is even more dire than the above data would suggest. Focusing on the Fed’s preferred measure of “supercore” inflation, which also strips out shelter effects, the three-month annualized change is now over 8%.
(chart by Apollo via @talmonsmith)
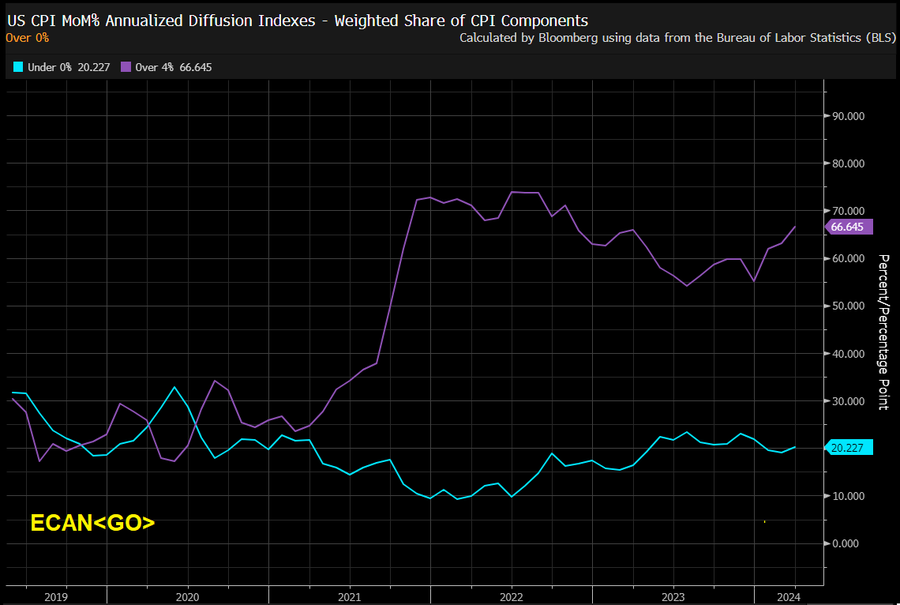
And the dispersion looks worrying – the number of CPI components increasing at more than 4% year-on-year is climbing (purple line).
(chart via @M_McDonough)
This is stubborn inflation any way you look at it, and effectively puts the lid on any potential rate cut in June.
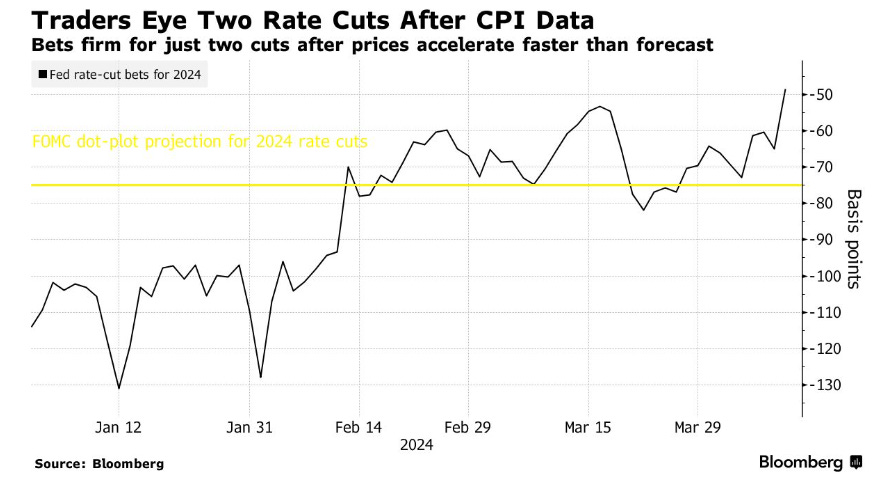
CME-priced expectations of a cut in June have dropped from almost 60% before the data release, to around 15%, with consensus coalescing around two cuts for 2024, less than the Federal Reserve’s official projection.
(chart via Bloomberg)
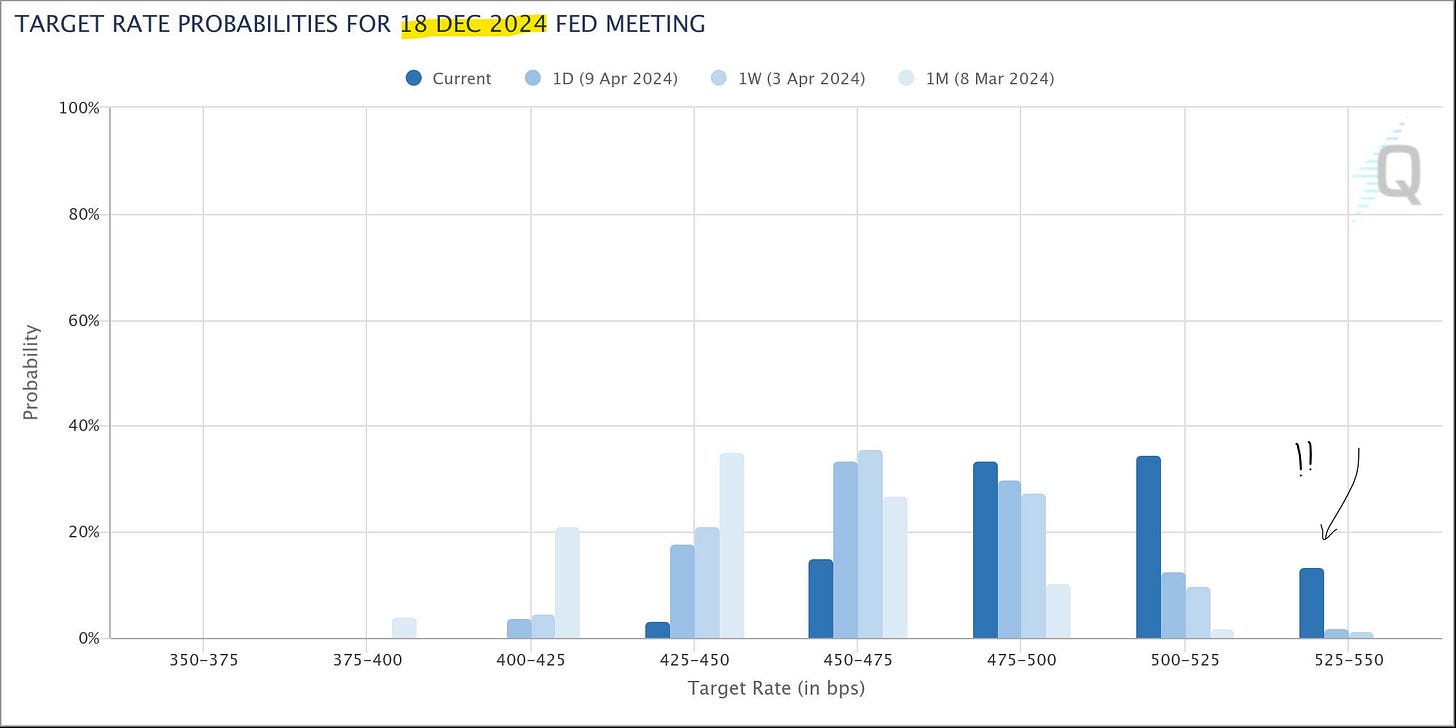
What’s more, the market probability of no cuts this year has jumped from almost nothing to 15%, and calls for another hike are getting more frequent.
(chart via CME FedWatch)
This jolted markets, much more than previous CPI releases – in part, this is because yesterday’s data marks the third consecutive month in which the actual figures exceeded consensus expectations. One month can be a blip, two can be a coincidence, but three is harder to brush away.
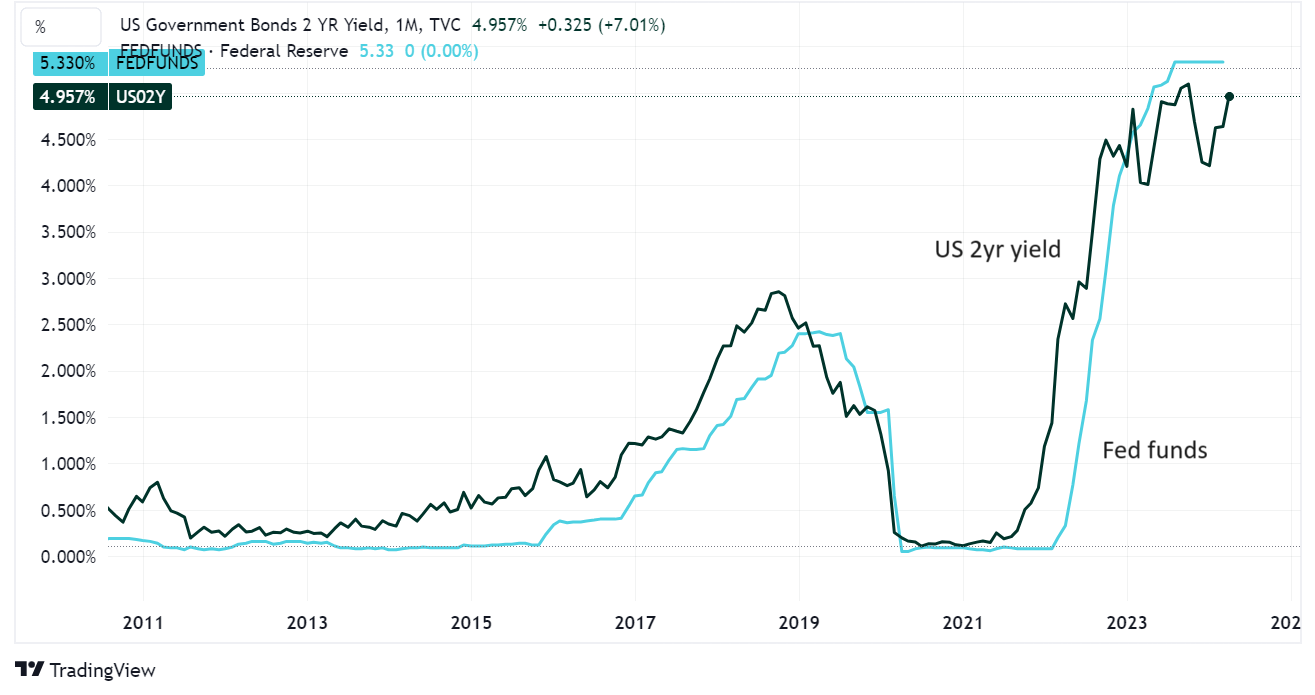
The US 2-year yield leapt up, and earlier today was above 4.95%. This is not far from the current level of fed funds, which suggests a very low conviction in short-term cuts.
(chart via TradingView)
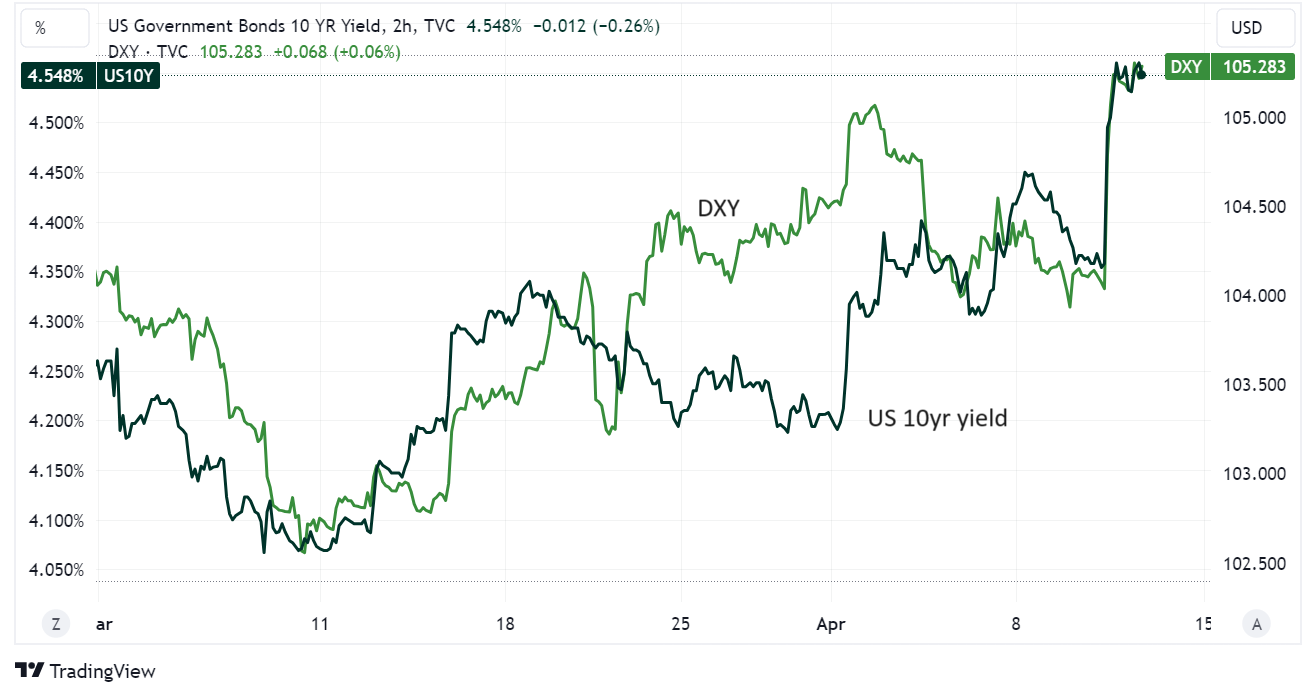
The US 10-year yield soared above 4.5%. And the DXY dollar index jumped by the most since January. Both are currently at their highest point since last November.
(chart via TradingView)
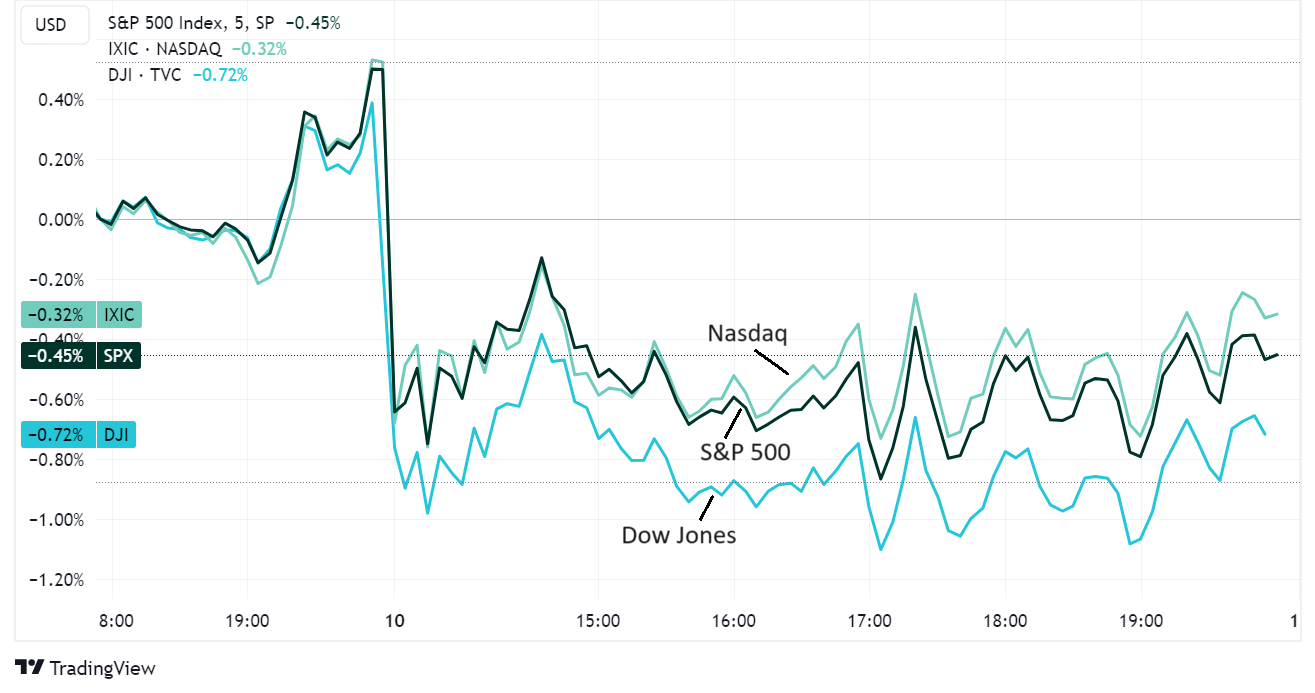
Spooked equity investors pushed the main US stock indices down by roughly 1%.
(chart via TradingView)
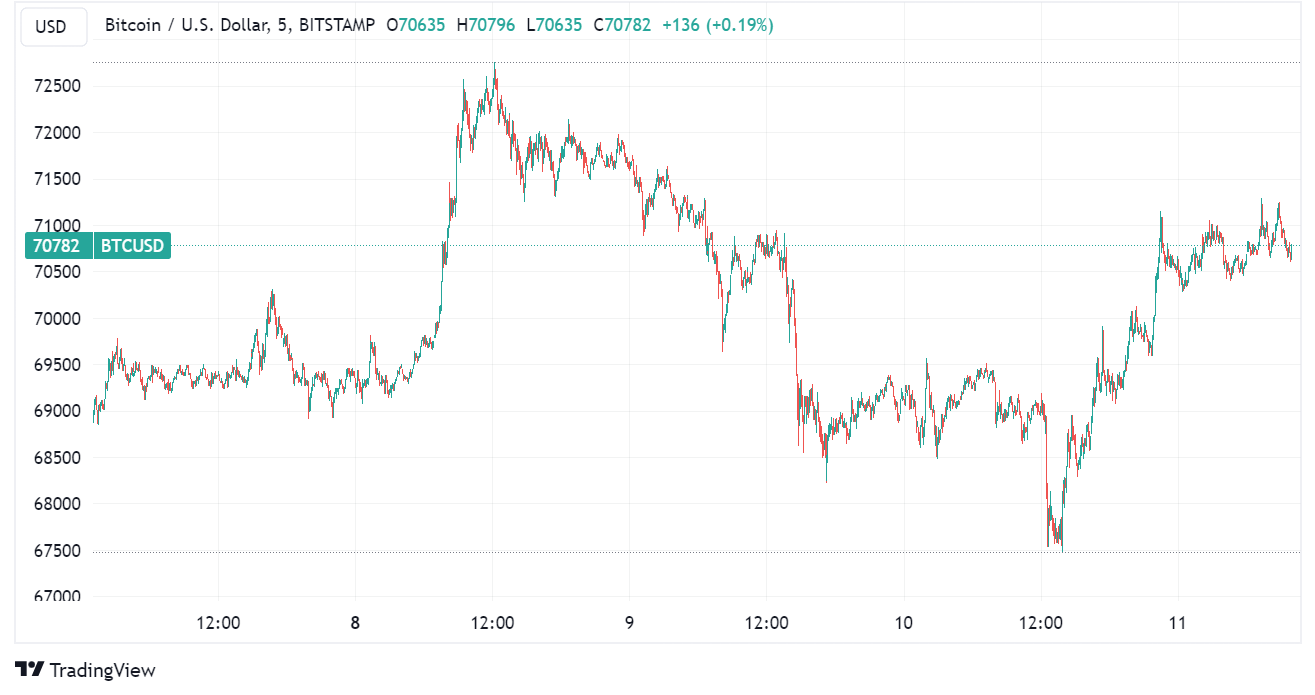
Against this backdrop, you would expect BTC to drop sharply – it tends to decline when the DXY and US yields are strong, and when investors are selling stocks. But we didn’t see that. After an initial drop, BTC recovered and then continued to climb, breaking through $71,000 again earlier this morning.
(chart via TradingView)


