Thursday, Jan 25, 2024
BTC and macro, Argentina's new currency, PMI confusion, a cuppa tea
“In the long run even the most expected of futures tends to arrive late and in completely unexpected ways.” – Paul Saffo
Hi all! I’m feeling pretty pleased with myself that so far this month I have not made a mistake on the year… Not feeling so pleased with myself, however, on my sound recording ability. Will do some tutorials this weekend, hopefully I’ll be able to start including audio next week.😬
You’re reading the daily premium Crypto is Macro Now newsletter, where I look at the growing overlap between the crypto and macro landscapes. There’s also usually some market commentary, but I don’t give trading ideas, and NOTHING I say is investment advice. For full disclosure, I have held the same long positions in BTC and ETH for years, and have no intention to either buy more or sell in the near future.
If you’re not a subscriber, I do hope you’ll consider becoming one! It would help enable me to continue to share what I learn as I work on figuring out where we’re going.
If you find this newsletter useful, would you mind hitting the ❤ button at the bottom? I’m told it boosts the distribution algorithm.
Note: I’m speaking at BlockWorks’ upcoming Digital Asset Summit conference in London on March 18-20. Normally I say no to conferences, but this is one of the very few worth travelling for. If you’re thinking of going, it’d be great to say hi, and here’s a discount code you can use: CIMN10.
IN THIS NEWSLETTER:
Don’t lose sight of bigger-picture signals
What the Purchasing Managers’ Index is really saying…
Argentina and new currencies
Reading the tea leaves
WHAT I’M WATCHING:
Don’t lose sight of bigger-picture signals
Here are three charts worth keeping an eye on:
1) One is the yield curve inversion. In the middle of 2022, the spread between the yields on US 10-year and 2-year government bonds went negative, which has preceded every single recession since the 1970s. It is about to turn positive again, which history shows usually coincides with a local stock market top.
(chart via TradingView)
Right now, sentiment looks upbeat, economic data suggests growth can continue to stay resilient while price increases decelerate, and liquidity conditions are pretty good even before any rate cuts.
But we’ve been here before: “soft landing” chatter was everywhere in 2007, earnings and economic data are generally backward looking, and markets tend to head up until they don’t.
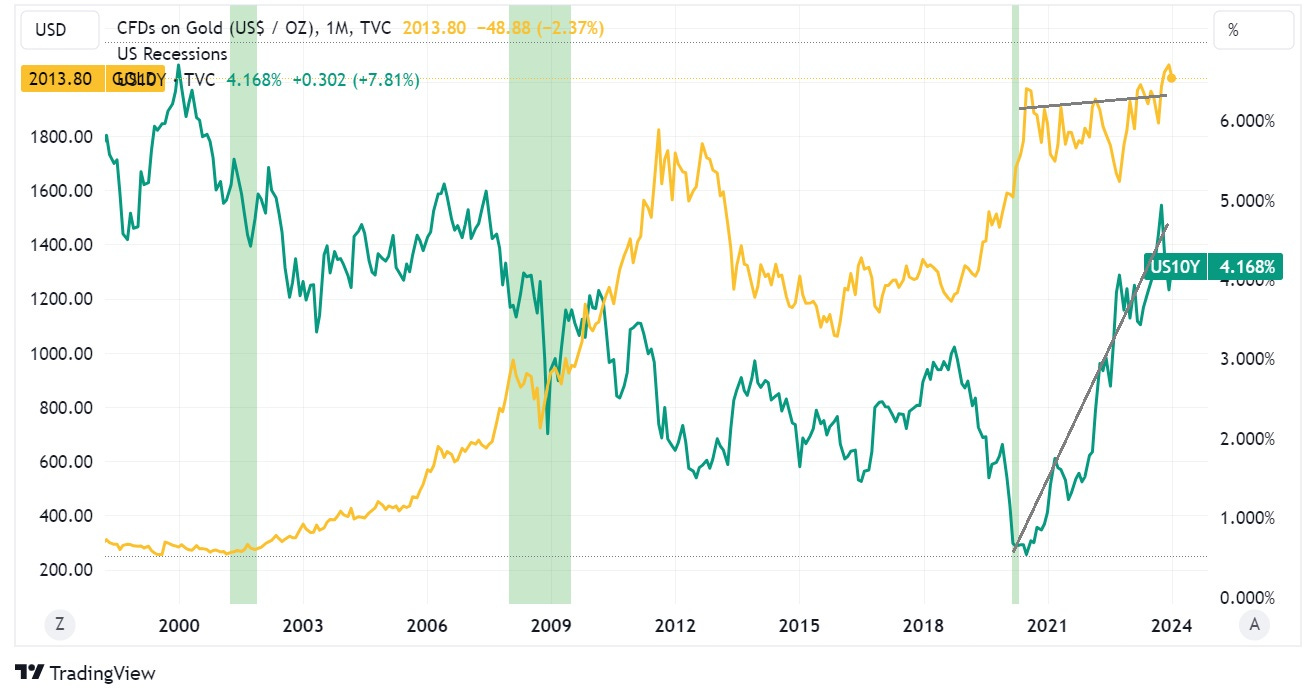
2) Another chart to watch is the US 10-year yield vs the gold price. In theory, they should move in opposite directions – gold doesn’t yield anything, and so is less attractive when yields are high elsewhere. Also, high US yields are good for the US dollar, which tends to weaken the relative value of US dollar-priced commodities.
(chart via TradingView)
We’ve seen this pattern hold over the past month, which suggests that gold could have further declines ahead. But, zooming out, the steep ascent of 10-year yields over the past three years did not dent the upward direction of gold prices. This confirms that there is indeed a growing interest in hard assets – hedges are always a longer-term concept.
(chart via TradingView)
3) And here’s the gold price together with the BTC price – over the past six months or so, they’ve sort of moved in tandem (of course, BTC has notably outperformed gold, but it’s the directionality I’m interested in here). Given the noise around the spot ETF launches, you’d think that there’d be more divergence.


